Data Analysis ReConnect: Conclusions Student Questionnaires
Social Media and young people are intrinsically linked to each other. As innovators, young people are the ones who get absorbed into new technological trends which makes them also heavyweight users of social media. Young people from an early age are being exposed to social media and online tools for leisure, socialization and education. This makes the young generation, also referred to as Millennials, very savvy and skillful when it comes to using online tools and social media. On the other hand, this generation is criticized for the lack of social skills when it comes to face-to-face communication. This generation is perceived as disconnected from the ‘offline’ aspect of life, due to their immersion into the online aspect. There is this generational gap, struggle and tension between generations. The primary challenge for educators and students is to find common ground which will benefit both generations. Below the Student Questionnaire Conclusions:

Outline Project ReConnect
The Project Reconnect is a project coordinated by San Gorg Preca Middle School in Malta, ULUÇINAR ORTAOKULU secondary school in Turkey, Prisms from Malta and the Dutch Foundation of Innovation Welfare 2 Work from The Netherlands. ?The project is co-funed by the Erasmus Plus programme of the European Union.
The primary challenge for educators and students is to find common ground which will benefit both generations. The educators need to learn how to use the characteristics of the Internet and use them to be relevant to the young generations. The students need to learn more about how to socialize offline and be equipped with the skills to navigate safely and efficiently in the online world. This project is linked to EU’s Digital Education Action Plan which speaks about three main objectives:
1. Making better use of digital technology for teaching and learning
2. Developing relevant digital competencies and skills for the digital transformation
3. Increase students’ media literacy
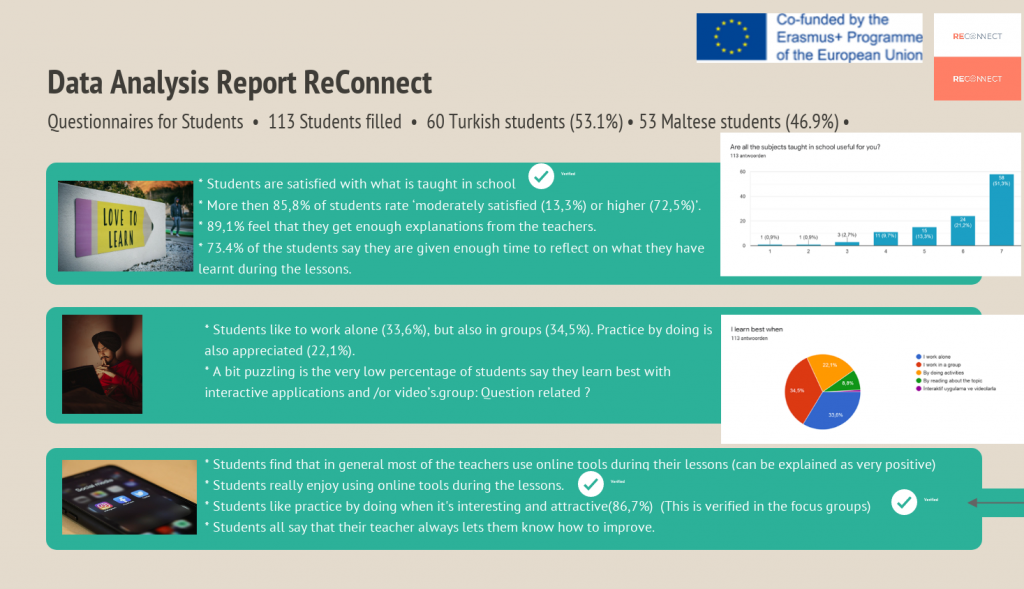
‘More then 85,8% of students rate their lessons ‘moderately satisfied (13,3%) or higher (72,5%)’.
Stat Data Analysis Report: Digital Teaching and Learning (to be published soon)
Data Validation
The data collected have been done trough two methods of inquiry; focus groups and questionnaires. The focus groups have assisted us on important elements which to design the a second round of questionnaires. The Quantitative data Analysis steps we have done are:
- data validation;
- data editing; and
- data coding
Our conclusion is that the questions in the questionnaires and focus groups are valid. In general the questions and follow up questions were done consistently.
Conclusions Student Questionnaires
From the total of 113 students filling in the Student Questionnaires more or less an equal amount of students responded from Malta and Turkey. 60 Turkish students (53.1%) against 53 Maltese students(46.9%). It’s good to note here that in general we have not identified a significant difference in replying among the student populations from Tukey and Malta in the questions of the questionnaires.
The vast majority of the students (96,5%) are not negative on what is taught during the school lessons. Over 50% of students score 7 out of 7. So you can conclude from this questionnaire that students are satisfied with what is taught in school. More then 85,8% of students rate ‘moderately satisfied (13,3%) or higher (72,5%)’.
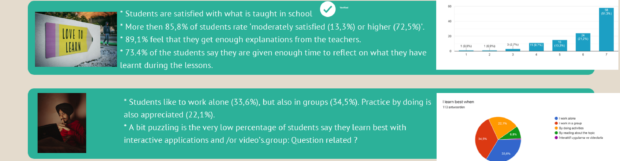
Students like to work alone (33,6%), but also in groups (34,5%). Practice by doing is also appreciated (22,1%). What really stands out and is a bit puzzling is the very low percentage of students say they learn best with interactive applications and /or video’s. Certainly when you keep in mind that average smart phone use per day is 3 hours and 35 minutes in our target groups in 2020 (Source: eMarketer 2020). Other research found that students currently do use applications and video’s, but see this use more as ‘fun’ then as a ‘tool to learn’. So regarding this particular question (I learn best when..?) it would be good to double check, so we are not being sent in the wrong direction: You could easily argue that you can work alone, reading a book and/ or work alone and use a interactive application at the same time.
The statistics show that students find that in general most of the teachers use online tools during their lessons. Only a small percentage (15.1%) of students think otherwise. These stats can be explained as very positive and more or less emphasizes that teachers are prepared to use online tools and actually use them as support teaching tools. More then half of the student really enjoy using online tools during the lessons.
As regards to the question ‘I Learn more about a topic by watching a video than listening to the teacher’: When the question is stated like this it seems it’s like the students have to choose for the video as a replacement for their teacher. When you put it this way it’s clear that students don’t want to replace their teacher for a video. Only 13,3% think that a video is always better than a teacher. 55,5% prefer a teacher over a video. On the other hand, the influence of digital videos on our day to day life and culture is undeniable. Online video sharing sites such as YouTube, Vimeo boast monthly audience numbers in the millions. With digital videos continuing to gain popularity, it seems only natural that this familiar and widespread platform should extend into the education system. In a nutshell, videos are good teachers, but a teacher is needed as well.
Almost half the students usually google when they want to find answers about certain subjects. One third just ask someone. As only 1 answer could be ticked, it’s clear that students will also ask someone after they could not google it (or the other way round). Students like to be active, practice by doing. On average a lot of students are afraid of making mistakes at school…
Are very good feedback for the teachers: The explanation in school about the learning is well received by the students. 89,1% feel that they get enough explanations from the teachers.
Students are in general also very satisfied with their reflection time. 73.4% of the students say they are given enough time to reflect on what they have learnt during the lessons. Only 16% in total are a bit to very dissatisfied.